Designer/Explorer
We don't believe we need to separate developers from end users. Granted we understand there are different levels of technology knowledge. However our approach is to make simple access easy and give everything to everyone, but let users decided how deep they want go.
The designer is where you can modify existing visualizations or imagine new ones.
We’ve made our data exploration smart to reduce time to results. We find meaningful results for you and we make assumptions to visualize them instantly. But you can go further. Anyone is able to modify our assumptions and get to their desired visualization. You are the creator, you are the designer. We’re just here to make your life easier.
We also understand that many end users might not really care to design their stuff. They just need to get to answers quickly and efficiently with your guidance. So we've developed easily accessible tools in our designer to help you guide users on their journey to immediately valuable insights. By the way, this same designer is available to your clients, because they may have super users of their own.
The four main parts of the Quick Intelligence Designer are the:
- Search Bar - find exactly the information you are looking
- Visualization Properties - configure the visualization to meet your presentation needs
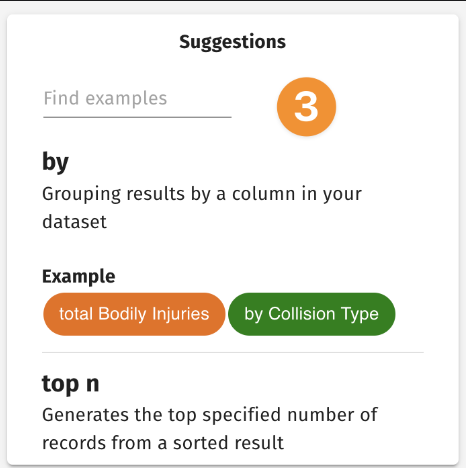
- Suggestions - get help and insights on AI recommended questions
- Data Explorer - view all the available data elements with descriptions from your data sets

Search Bar
The search bar provides an easy way to get answers to important questions.
- Type Ahead Attribute reference
- Type ahead keyword reference
- Virtual attributes - calculated fields
- Keywords for complex operators
- Integrated datepicker

Advance Search
Advanced Search provides support for post aggregation functions and filters. Great for weighted values etc.

Help and Suggestions
Get relevant suggestions for operators and attributres based on your dataset. In addition get to know how operators work better with help text and examples.

Smart Visualization
Select from a wide range of options including:
- Chart type
- Title and Number formatting
- Color palettes
- Drill down suggestions

Exploration
Explore what your data model has to offer with a full descriptive list of your data's attributes, calculated fields, and more.

Date Picker
Configure defaults for easy flexible integration, range selection, range control, grain selection
- Assigned to specific attributes
- Fast easy grain selection
- Fast easy range selection
- Applied to individual QI or across dashboard
